Hydrogen Distribution
The distribution of hydrogen is as important as the production of it. There are different ways to do it based on the final form of hydrogen liquid or gaseous.
Liquefaction
Regarding the H2 liquefaction plant, our suggestion is the implementation of an infrastructure, like the one presented below (Figure 1). It is based on an already existing LNG liquefaction plant, that is proposed by Wärtsilä and it is used as a benchmark.

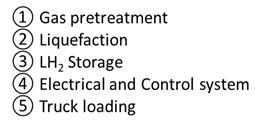
Figure 1: H2 liquefaction plant
Its operation employs the 2-stage He Brayton cycle as it is presented as one of the recommended ones for further investigation at [2].

Figure 2: 2-stage He Brayton cycle
The above configuration is a suggestion for improvement of the already existing standard He Brayton cycles. The purpose is the improvement of thermodynamic performance along with reduction of energy cost if possible.
This system combines simplicity with efficiency as it exploits the single-loop cycle with two turbo-expanders in series. Also, it has several merits over already existing Clause systems, regarding safety, i.e., low pressure operation, simplicity, i.e., no branching flow, and less contamination, i.e., no existence of Joule-Thompson valve.
A key characteristic of H2 liquefaction is the requirement of ortho-to-para conversion, as H2 can exist in two different molecular forms, i.e., para-hydrogen and ortho-hydrogen. Para-hydrogen has a lower energy level and therefore ortho-hydrogen is converted to para-hydrogen during its liquefaction in order to reach the liquid state at stable equilibrium.
During the cycle, there will be an increase at the pressure and therefore we suggest connecting a throttle valve to the outlet of the system. The outlet of the throttle valve will be connected to a drum at which the liquid will remain at the lowest level and the vapor due to boil-ff at the top. Finally, with proper piping system the vapor can be recovered and sent to the input of the liquefaction system. With this closed-loop system, the liquefaction system can expand to reliquefication system to decrease the losses due to boil-off phenomena and exploit more quantity of hydrogen supplied.
The energy demand of this configuration is approximately 12 kWh/kg LH2, whereas the demand for compression is 6.5 kWh/kg gaseous H2. H2 liquefaction requires almost double the energy per kg compared to the amount needed for compression of gaseous H2. Even though it is a drawback of LH2, it can be overlaid by several advantages as mentioned.
Storage
Storage on-board
For safety reasons, it is assumed that the maximum capacity of the case vessel’s tank will be the 85% of its nominal capacity. The nominal capacity is 560m3, so the maximum allowed volume is:
85% of the tank’s capacity is assumed to be filled because, after several processes of loading and discharging, there are some remnants of cargo. This percentage can be in a worst-case scenario up to 5% of cargo’s DWT in the tank. So, it is safe to assume that there will not be 3 consecutive worst-case scenarios (3x5%=15%) that could potentially destroy the tank and therefore 85% of the tank to be filled.
However, there are two issues that must be taken into consideration and they are related to the current position of the tank on-board and its current insulation. The tank is currently located at the inner hull of the vessel and its relocation will be investigated by the shipping company and it is out of this group project’s scope. Moreover, the insulation that we suggest as a team is the multilayer insulation (MLI) to be applied. This insulation fits the cryogenic environment that needs to be created inside the tank so as the H2 to be stored in liquid form [5].
Storage onshore
Considering 5 times the demand, for abundancy, we calculated how many storage vessels needed to store the produced LH2 at two different sites; at the production area and the port. For storage at both areas, 1.5 m distance between the storage tanks to create a path for maintenance was considered [7] and taking also into account the dimensions of each tank, we calculated the area occupied at the production site and the port as 239.4 m2 and 84.5 m2, respectively.

Figure 3: Configuration of 1.5 distance between the storage vessels.
From Figure 4 which present these two areas, it can be observed that the available space is larger than the one occupied by the tanks.

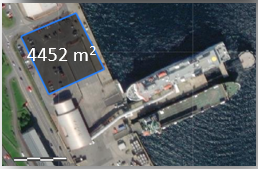
Figure 4: Areas of the production site and the port site.
It is noteworthy, that the aim of the buffer storage at the port is to store the exact amount that will be refueled to the ferry and be ready to use.
The table shows the specifications of each tank and their quantity at each site. They are designed to maintain the cryogenic environment that H2 needs to be stored in its liquid form.

Figure 5: Linde's cryogenic vessels
Table 1 :Liquid Hydrogen Tank specifications
Transportation
As for the transportation of LH2 is concerned, it will take place via the utilisation of trucks instead of pipes. Piping system is not suggested for LH2 transportation because it is much more expensive than the exploitation of trucks. Furthermore, in order to transfer LH2 via pipes, they must be with appropriate insulation layers. Thus, the weight would be extremely high, and this is impractical in terms of engineering. Lastly, with regards to potential leakages, it is impossible to avoid such events during a homogeneous pipeline system of 1km, as it would be at our case scenario, in case of choosing pipes instead of trucks [3].
For longer distances, transporting hydrogen in liquid form is usually more cost-effective, since an LH2 tank can hold larger quantities of hydrogen than a pressurised gas tank.
The industry varies between four different types of bunkering methods [4]:
-
Truck-to-Ship (TTS) which is used for small-scale bunkering and incudes a few trucks as discharging units at a size of approximately 50-100 m3 for each truck.
-
Ship-to-Ship (STS) which incorporates either a bunker vessel or a barge with size approximately 200-10,000 m3.
-
Pipeline-to-Ship (PTS) which, at the terminal venue, uses a satellite terminal as the discharging unit for bunkering purposes. Its size amounts to 100-10,000 m3.
-
Portable tanks that is an approach during which empty tanks are replaced by full ones. This procedure transports LH2 as fuel by implementing loading/unloading and connection/disconnection of the respective tank systems.
In our case scenario, the vessel’s tank capacity is 33,796 kg of LH2 (476 m3), while the actual demand of our ferry is 25,789 kg of LH2. Apparently, the supply of our case vessel can be considered a small-scale bunkering problem and therefore the utilisation of trucks for transportation seems to be a feasible option at this stage.
Each truck carries a capacity of 4,000 kg LH2 (56.34 m3), so the required number of trucks was calculated to be 9 trucks. The distance between the production and the port is 1km long and that is why 9 trucks to operate at such a small distance can cause traffic congestion at the port and at the same time significant increase of OPEX. PTS and Portable tanks are not feasible solutions in our case because both significantly increase the CAPEX. PTS increases the cost due to the required insulation and Portable tanks because of the need of the construction of a dry dock in Shetland dedicated to this purpose.
Hence, we decided to assign 2 trucks to carry out more daily scheduled routes, along with 1 truck as a backup so as not to delay the ferry’s schedule in case of a breakdown, regarding the refueling. The transfer will be from a buffer storage to the ferry, using the trucks to load it while the ship is not anchored. The trucks are already in market and Linde is a potential supplier. The truck is shown at the figure below, with the following specifications (Table 2).

Figure 4: Linde's truck
Table 2: Truck's specifications
All the calculations described above are included in the excel file, attached at the end of the page of the methodology section
References
[1] Shell, "Sustainable Mobility through Fuel Cells and H2," 2017.
[2] H.-M. Chang, K. N. Ryu and J. H. Baik, "Thermodynamic design of hydrogen liquefaction systems with helium or neon Brayton refrigerator," Cryogenics, vol. 91, pp. 68-76, 2018.
[3] M. E. Demir and I. Dincer, "Cost assessment and evaluation of various hydrogen delivery scenarios," International Journal of Hydrogen Energy, vol. 43, pp. 10420-10430, 2018.
[4] GL, "Study on Standards and Rules for Bunkering of Gas-Fuelled Ships," 2012.
[5] J. Moreno-Blanco, G. Petitpas, F. Espinosa-Loza, F. Elizalde-Blancas, J. Martinez-Frias and S. M. Aceves, "The storage performance of automotive cryo-compressed hydrogen vessels," International Journal of Hydrogen Energy, vol. 44, pp. 16841-16851, 2019.
[6] L. Decker, "Liquid Hydrogen Distribution Technology, Linde," Brussels, 2019.
[7] Pointandsandwick.co.uk, 2021. [Online]. Available: http://www.pointandsandwick.co.uk/wp-content/uploads/2019/07/Scottish-Western-Isles-Ferry-Transport-using-Hydrogen-Feasibility-Report.pdf. [Accessed: 12- May- 2021].