Methodology for the Hydrogen consumption
The hydrogen consumption calculation was a fundamental step for the feasibility study, as the highest requirement for the project is to match the production rate with the demand, carefully considering the energy requirements, safety and components necessary for this delivery. A financial analysis is performed based on these main components necessary to attend the demand.
To estimate how much H2 would be needed in this ferry two main questions have been analyses further in this section
The two main questions
Which would be the range of Hydrogen consumption?
Using the calorific value difference from the current fossil fuel consumption and Hydrogen fuel, it was possible to calculate an average mass of H2 able to provide the same energy currently needed, considering the estimated change in energy efficiency if the internal combustion engines were replaced with PEM Fuel Cells.
In which conditions of pressure and temperature should Hydrogen be stored onboard?
To determine the most adequate state (compressed gas or liquid) hydrogen should be delivered, three requirements were considered and described.
All the calculations described below are included in the excel file, attached at the end of the page
The fossil fuel consumption
The fuel consumption from MV Hrossey was estimated assuming that currently Heavy Fuel Oil (HFO) is preferred, as it is cheaper than Marine Diesel Oil (MDO) [1]. This way, the Hydrogen mass consumption (FH2-m) was calculated through the following equation, also accounting for the estimated difference in efficiency between the internal combustion engine and a future Fuel Cell in this switch.

Where:
FHFO-m is the HFO mass consumption; uH2 is the Lower Heating Value of Hydrogen.; uHFO is the heat value of HFO; ηIC is the efficiency of the internal combustion engine assumed of 45% [2]; ηFC would be the efficiency of the Fuel Cell estimated of 40% [3].
Two methods were used to calculate the ferry’s HFO consumption, and a mean value was considered
Method 1: Using the reported CO2 emissions from flow meter’s monitoring at the EU THETIS-MRV database [4], the HFO consumption could be calculated with the following equation:

Where:
R is the CO2 emissions reported.
ECO2 is the HFO average CO2 emissions [5, 6] considering its density [7] at 15°C of 900 kg/m3.
Method 2: Using the specific factors for standard rate of fuel consumption, speed, and maximum continuous rating according to the main engine power, the HFO consumption was estimated through the following equation:

Where:
HFOc is the Heavy Fuel Oil Consumption; P is the ship installed engine power; SR is the standard rate of fuel consumption; S is the ferry speed; pHFO is the density of HFO and %mrc is the maximum continuous rating, or the percentage of ship power applied.
Decision for Gaseous or Liquid H2
The hydrogen scenario has been compared with the current use of Heavy fuel oil in three aspects:
A) Inner volume of the tanks onboard
B) Range given by the full tank
C) Refueling time.
Maximum inner volume and range
Requirement A- The H2 volume should not exceed the volume occupied by the Heavy Fuel Oil;
Requirement B- The minimum range should be one round trip, to avoid refueling in cities different than Lerwick);
Although the heat value from H2 is almost three times higher than HFO, its energy content per unit volume can be much lower than HFO depending on how it is stored (gas or liquid [8]), implying that the range this ferry would achieve with H2 would be limited by the volume the new tanks could occupy. And in this study, it is assumed that in the switch of fuels, the H2 tanks would preferably not exceed the volume occupied by the Heavy Fuel Oil tank. The inner volume has been calculated using the following equation:
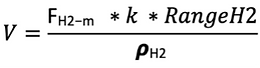
Where:
RangeH2 is the maximum distance the hydrogen vessels provide (for LH2 this range accounts for 85% maximum filling capacity); k is the safety factor for fuel reserve; FH2-m is the H2 consumption calculated further in this page and pH2 is the density of hydrogen at the specified conditions of Temperature and pressures.
Maximum time to refuel the ferry's H2 tanks
Requirement C- HrH2 ⩽ 8 hours (HrH2 is the hours taken to refuel the H2 tanks to 85% capacity)
As the Ferry stops four times per week in Lerwick, the daily H2 demand was also calculated, assuming that it would be at dock for a maximum of 8 hours. This would be the maximum time (MaxHrH2) to refuel the ferry's H2 tanks to 85% of their capacity [9]. This way, it is possible to estimate a total of 40 hours available to produce the required TH2, which was an important parameter to consider for the distribution (storage and transport) calculations.
To calculate the frequency the ferry needs to be refueled two items were important to consider:
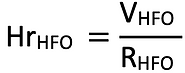
A) The delivery rate of each fuel from the shore to the ship (R): with this value, the hours taken to refuel the tanks with hydrogen (HrH2) and Heavy Fuel Oil (HrHFO) could be calculated and compared.
B) The Range given by each fuel: to better understand the implications of the hours taken to refuel the range is crucial, as the difference in refueling frequencies determines the accumulated days per year (Dy) the ferry is not at sea due to refueling operations.
Therefore, first, analysing (A) the values for R, HrH2 and HrHFO in each case were determined as described:
-
RHFO: it is assumed that the passenger ferry refuels with HFO while anchored at the port in Shetland, rather than in movement, through bunkering barges. On average, barges can pump fuel at a ratio of 110 tones of fuel per hour, which gives roughly 13.25 m3/h [10]. The HrHFO was calculated through the following equation:
-
RGasH2: cascading dispensing is commonly used in gaseous hydrogen stations [9]. The gas would be delivered from a land-side storage of 1000 bar to the lower pressure's tanks in the ferry, which allows faster refueling when compared with other refueling configurations, such as through direct compression from a lower pressures vessels [9]. However, the expansion during the cascading dispensing creates a heat load in the gaseous hydrogen due to its Joule-Thomson Effect [11,12], and currently the rate to refuel is limited to avoid potential hazards as specified by SAE J2601 [9, 11]. The average dispensing rates (Raverage-GasH2) in this case have been reported at 432 kg of H2 per hour[9] however, according to [9], faster refueling rates can be achieved if more dispensers were used simultaneously.
-
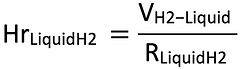
RLiquidH2: the liquid H2 can be delivered to the ferry using special vacuum isolated hoses, like LNG [13,14]. This allows it to be refueled much faster than with gaseous hydrogen, as the diameter and number of hoses can be adjusted depending on the needs. The flow rate reported is for their use was found at 300 m3 of LNG per hour, and this value have been considered a safe approximation for LH2. Therefore, the HrLiquidH2 was calculated by the following equation:
The accumulated days per year (Dy) was calculated accounting for Ranges given by each fuel through the following steps.
-
DyH2: as the frequency of refueling for Hydrogen is defined as every 40 hours, the total number of refueling operations per year (TRO) was estimated by:
DyH2 was given by:

-
DyHFO: calculated based on the calculated range achieved with HFO and its total hours of operation (Hop) between refueling. Dy could then be calculated with the following equation:

Results and Discussion
Hydrogen consumption rate and total demand
The methods to calculate the HFO consumption obtained different average values, and the calculations can be seen in the Excel document, along with all the sources used for the values. The mean value shown in Table 1 was used for the equivalent hydrogen demand calculations. The volumetric HFO consumption calculated was transformed into mass consumption (FHFO-m) multiplying it by its density (𝞺HFO ) of 1010 kg/m3 at 15°C.
Table 1: Heavy Fuel Oil Consumption from MV Hrossey.
Then, the Hydrogen mass consumption rate (FH2-m) could be estimated accounting the changes in engine efficiencies, as described in the methodology, and the total H2 consumption (TH2), considered for the storage and energy demand calculations, was estimated for a maximum range of one round trip. One round trip was defined due to the results shown by the Volume calculations further in this page, as lower ranges would imply a need to refuel in cities different form Shetland, which was considered as undesirable. Similarly, higher ranges, such as two round trips, even with liquid H2 which has a much higher energy content per unit volume than gaseous H2, would only be possible if the volume occupied by the H2 vessels could exceed the HFO tank's volume, as the results further in the section explain. TH2 was estimated using the following equation:
Where D is the total km for the round trip (Lerwick-Kirkwall-Aberdeen); k is the safety factor for fuel reserve.
Table 2: Hydrogen fuel consumption rate and total demand
As ferries needs to go through maintenance in dry docks facilities periodically [9] it is assumed that the Aberdeen dry dock Dales Marine Services is preferred, as it is already in one of the stops of this ferry's route, therefore the H2 calculated would be enough for such travels.
Gaseous Hydrogen or Liquid Hydrogen?
To study which state of Hydrogen would be preferable, the three requirements described in the methodology were analysed, by fixing the RangeH2 as one round trip (see Requirement B explained).
Analysis Requirement A with Requirement B fixed
The volumes were calculated for both liquid and gas H2 considering that for the case of compressed hydrogen, 520 bar currently is the highest pressure for such high demands calculated up in this section, as [9] reported the composite vessels Type 4 at 520 bar can be developed in close partnership with providers in this maximum pressure at present. However, it would be beneficial to have higher compressions such as 700 bar to decrease space requirements, which is the usual pressure used for mobility [11]. As this pressure of 700 bar could become viable in the future, VH2-700bar has also been calculated together with VH2-520bar, and VH2-Liquid, and the graph 1 allowed the comparison of results with VHFO , to visualize if the first requirement could be achieved.

Figure 1: Tank Volume
As can be seen in the graph 1 and table 3, the ΔVH2-liquid (colored in green) is the only which fulfills this requirement, representing a decrease of 24% in the inner volume of the tanks when compared with VHFO .
Table 3: percentage difference in tank volume comparing H2 with HFO
Therefore, it is possible to conclude that to fulfil Requirement A, the switch for Hydrogen would imply two aspects:
1- The ferry will need to refuel at least once during the round trip, in any case, gaseous or liquid.
2- The LH2 would be the best option, unless the ferry could stop more at least twice to refuel along the round trip; something it is assumed not desired. However, this increased number of refueling stops for the use of gaseous H2 is also discussed further in this Worksheet.
It is important to note that the spaces occupied by the tanks are higher than the ones calculated in this study due to the storage materials, especially for liquid hydrogen, which requires insulation to maintain the low temperature of -253 oC. According to [12], insulation thickness can reach 1.8 meters, however, as detailed specifications from the storage tanks were not available due to commercial sensitiveness, the outer volume remains to be estimated in future works, and only the inner volume is being compared with the inner volume of the HFO tanks.
Analysis Requirement C with Requirement B fixed
To calculate the frequency the ferry needs to be refueled and understand if the Requirement C can be fulfilled by either gas or liquid H2, the average dispensing rate (Raverate-GasH2) of 432 kg of H2 per hour [9] was considered very low, to deliver a demand of over 25 tones of H2, necessary for a round trip. As explained in the methodology, considering a higher number of dispensers at the port it is possible to fix HrGasH2 at the maximum time of 8 hours (MaxHrH2) to estimate the minimum rate (RGasH2) required to refuel the ferry in this determined time through the following equation:

The number of cascading dispensers required to deliver the H2 in this case (NCD) could be estimated as 8, dividing by RGasH2 by Raverage-GasH2, and

Table 4 shows the results for accumulated days per year (Dy) refueling for liquid and gaseous hydrogen, the number of hours taken to refuel, and graph 2 plots these values.
Table 4: Accumulated days per year refueling.
As can be seen LH2 shows an advantage compared with gaseous H2 and with HFO. This is due to LH2 be dispensed using insulated hoses, which allows it to be delivered much faster as explained in the methodology section. Also, it is possible to estimate that even with increased frequency of refueling given by the limited Range from H2 compared with HFO, LH2 refueling days accumulated per year (Dy) would be less than what currently takes to refuel an empty tank with HFO. This is highlighted by the colors in the table (green color shows the DyH2 value below DyHFO).
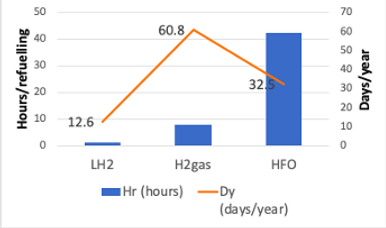
FIgure 2: Refuelling Time according to Fuel
It can be concluded from these estimations that LH2 would be the preferred option for this switch from HFO, rather than gaseous H2.
But what about gas H2?
Gaseous hydrogen would exceed the inner volume of the VHFO, as it presents lower density under standard conditions than in liquid state. However, its use was further investigated in this section, even though LH2 presented as most feasible as storing compressed gas is less challenging in terms of temperature maintenance [9], and it does not require insulation materials and refrigeration.
Also, the volume requirements presented for this ferry were estimations, and should not automatically be viewed as prohibiting for the use of gaseous H2, as it would be for a naval architect to determine the maximum available space to be occupied by the vessels.
Therefore, this section evaluates the practicalities of gaseous H2 in terms of inner volume and time to refuel, by modifying the Requirement B. This was made by replacing the total distance for the round trip (see Methodology B) with the distances specified by di described in the Figure 3.
Requirement B: RangeH2 = di.k
Where:
d1 = Refueling in all three cities (distance between Kirkwall and Aberdeen of 248 km [16], as it is the longest route);
d2 = Refueling in Shetland and Aberdeen (distance between Lerwick and Aberdeen of 433 km [16]);
d3 = Refueling in Shetland and Kirkwall (2 x distance between Kirkwall and Aberdeen of 248 km [16]);
Figure 3: Distances for range if more refueling stops existed.

By reducing the range, the inner volume from the H2 tanks decreased, as can be seen in table 5 and figure 4, falling below VHFO (fulfilling Requirement A). However, this represented a substantial increase in refueling frequency, and consequently, the accumulated days per year to refuel the tanks at dock will be much higher than the ones presented previously when compared with Heavy Fuel Oil. Therefore, it can be concluded that the use of gaseous hydrogen in MV Hrossey would only be feasible if either it could be stored in a higher pressure than 700 bar, if the space occupied by the H2 tanks could exceed the current VHFO, or if the faster refueling could become possible without increasing the number of dispensers at port.
Table 3: percentage difference in tank volume comparing H2 with HFO

Figure 4: Inner Tank Volume for different compressions and Range
Advantages of Liquid Hydrogen
The utilisation of LH2 has significant advantages over gaseous hydrogen and it is recommended in literature [17] as an effective way of distributing and storing fuel.
Firstly, LH2 is also better than gaseous hydrogen regarding the transportation for longer distances because it is more cost effective. That happens since a tank which carries LH2 can carry larger quantity of hydrogen than ones pressurised gas tanks can deliver. Moreover, in terms of the volume needed to store the same amount of hydrogen, LH2 requires less space than gaseous hydrogen as it has larger specific energy, i.e., 8.5MJ/L, compared to gaseous hydrogen’s, i.e., 7.2MJ/L. Finally, the recommended pressure for storing LH2 is less than the one suggested for gaseous hydrogen and therefore, it increases the safety of the application by mitigating potential risks such as explosion [17].
References
[1] Baird, Alfred J. (2012), Policy Implications of CO2 Emissions for Island Ferry Services, Pedersen Consulting. Available at: https://www.starconference.org.uk/star/2012/BairdPedersen.pdf
[2] Litwin, W., Le´sniewski W.; Pi D. and Niklas K. (2019) Experimental Research on the Energy Efficiency of a Parallel Hybrid Drive for an Inland Ship, Faculty of Ocean Engineering and Ship Technology, Gdansk University of Technology, Available at: https://www.mdpi.com/1996-1073/12/9/1675/pdf
[3] Salameh, Z. (2014) Chapter 4 - Energy Storage, Renewable Energy System Design, Academic Press, P. 201-298, Available at: (https://www.sciencedirect.com/science/article/pii/B9780123749918000040)
[4] EMSA THETIS-MRV (2021) EU Thetis-MRV Report, Available at: https://mrv.emsa.europa.eu/#public/emission-report
[5]International Maritime Organization (2015) Third IMO green house gas report. Available at:
[6]Krantz, Gustav (2016), CO2 and sulphur emissions from the shipping industry, CO2 and the maritime fuel switch, Trans Oleum. Available at: https://www.egcsa.com/wp-content/uploads/CO2-and-sulphur-emissions-from-the-shipping-industry.pdf
[7]MARPOL International Convention for the Prevention of Pollution from Ships (2011) Annex I, regulation 43 Available at: http://www.marpoltraining.com/MMSKOREAN/MARPOL/Annex_I/r1.htm
[8] Office of Energy Efficiency & Renewable Energy Hydrogen and Fuel Cell Technologies Office, Hydrogen Storage https://www.energy.gov/eere/fuelcells/hydrogen-storage
[9] Point and Sandwick Trust (2019) Scottish Western Isles Ferry Transport using Hydrogen (SWIFTH2), Available at: http://www.pointandsandwick.co.uk/wp-content/uploads/2019/07/Scottish-Western-Isles-Ferry-Transport-using-Hydrogen-Feasibility-Report.pdf
[10] Windstar Cruises (2020), How Much Fuel A Cruise Ship Uses. Available at: https://www.windstarcruises.com/blog/how-much-fuel-cruise-ship-uses/
[11] Caponi R., Monforti A. F., Bocci E., Valenti G., Pietra M. D., (2021) Thermodynamic modeling of hydrogen refueling for heavy-duty fuel cell buses and comparison with aggregated real data, International Journal of Hydrogen Energy, V. 46, P. 18630-18643, Available at. https://www.sciencedirect.com/science/article/pii/S036031992100817X
[12] SAE International (2016) Fueling protocols for light duty gaseous hydrogen surface vehicles (J2601_201612) Available at: https://saemobilus.sae.org/content/j2601_201407"
[13] ECONNECT Energy AS, Hydrogen, Available at: https://www.econnectenergy.com/markets/the-hydrogen-market
[14] SWZ MARITIME (2020) Bunkering facility not a must to get liquid hydrogen on board a ship. Availabe at: https://www.swzmaritime.nl/news/2020/09/09/bunkering-facility-not-a-must-to-get-liquid-hydrogen-on-board-a-ship/?gdpr=accept
[15] R.K. Ahluwalia, D.D. Papadias, J-K Peng, and H.S. Roh (2020) System Level Analysis of Hydrogen Storage Options, Annual Merit Review and Peer Evaluation Meeting, Available at: https://www.hydrogen.energy.gov/pdfs/review20/st001_ahluwalia_2020_o.pdf
[16]Orkney Islands Council (2010) Northern Isles Ferry Services (proposed) Efficiency Saving Options. Available at: https://www.orkney.gov.uk/Files/Council/Council-Responses/Northern_Isles_Ferry_Services__efficiency_saving_options.pdf
[17] Shell, "Sustainable Mobility through Fuel Cells and H2," 2017.
Hydrogen Methodology